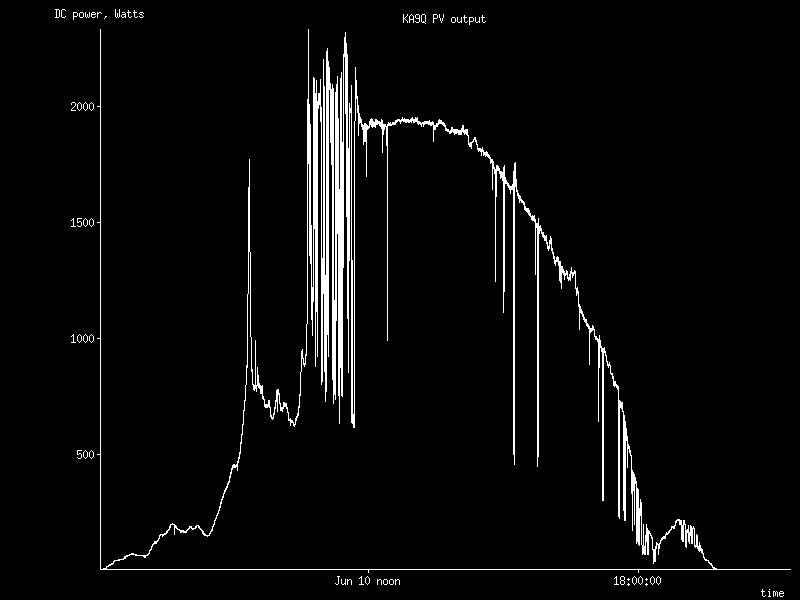
The data was collected by a pair of Radio Shack 22-805 VOMs with RS-232 interfaces connected to a Linux PC. One measures array voltage; the other measures array current via a shunt. Custom software polls the meters every second, computes array DC power, and logs the results. (I'll release this software under the GPL when I'm ready.)
Here is the plot as a GIF image. If you have Tim Shepard's excellent xplot interactive plotting utility, you can download the gzipped xplot file here and examine this plot in considerably more detail. Some of the features discussed below are not visible in this gif, so you have to use xplot to see them.

Here are some interesting things to note about this plot. This day started out completely overcast, as June days in San Diego often do. The sun briefly broke through some thin clouds at around 9:20AM, but it soon went back behind the overcast.
At 10:40AM, the overcast began to break up. During this period you can see large, rapid variations in generated power as the sun peeked through openings and was obscured again. Edge-of-cloud effect was also very strong during this time, sending peak powers well above what they would be for a clear sky.
About 11:40, the sky became mostly clear. Here the generated power starts to follow a sinusoidal curve as the sun slowly moves in relation to the array. The peak is close to, but not exactly coincident with, local solar noon because part of the array faces southwest. (Remember that during daylight savings time, solar noon occurs after clock noon.)
There are some occasional momentary (1-second) drops in array output, e.g., at 11:56:33. I attribute these to birds momentarily shading a panel. (I occasionally have to hose down my panels to remove bird droppings, as they like to perch on the ham antennas mounted above them.)
At 12:17:36 I began an experiment to measure the array output power as a function of the operating voltage. I did this by varying the inverter's sell voltage setting. This resulted in small variations in array power until 12:20:54. It turns out that my chosen array operating point of 54V is only about 1V below the array's peak power point, at which it produces about 10W more power. This confirms an analysis I performed several years ago (when I only had the Astropower panels) that shows a peak-power tracking controller isn't of much use in San Diego's warm climate.
The afternoon sky was mostly clear, with the occasional cloud. Many of these cloud events exhibit very clear edge-of-cloud effect, e.g., the one at around 15:14. Note how the power rises slightly just before it drops, peaks again as the cloud leaves the sun, and then drops back to its baseline clear-sky value.
The generated power continues to follow a very clear sinusoidal shape as the sun arcs across the sky.
Something odd begins to happen at around 17:30. The curve falls off noticeably faster, dips sharply at about 18:20, and then rises again until it begins to trail off again at around 19:00. Doesn't look like a cloud, does it?
In case you haven't guessed, this was a partial solar eclipse. Here in San Diego, the moon first touched the sun at 17:15 PDT, cut off a maximum of 80% of the sun's light at 18:24 PDT, and left the sun entirely at 19:24 PDT. Although there were scattered clouds during the eclipse, the overall trend is still quite clear.
--Phil Karn